1、软件安装及运行,见上一篇经验,“用matplotlib画图"
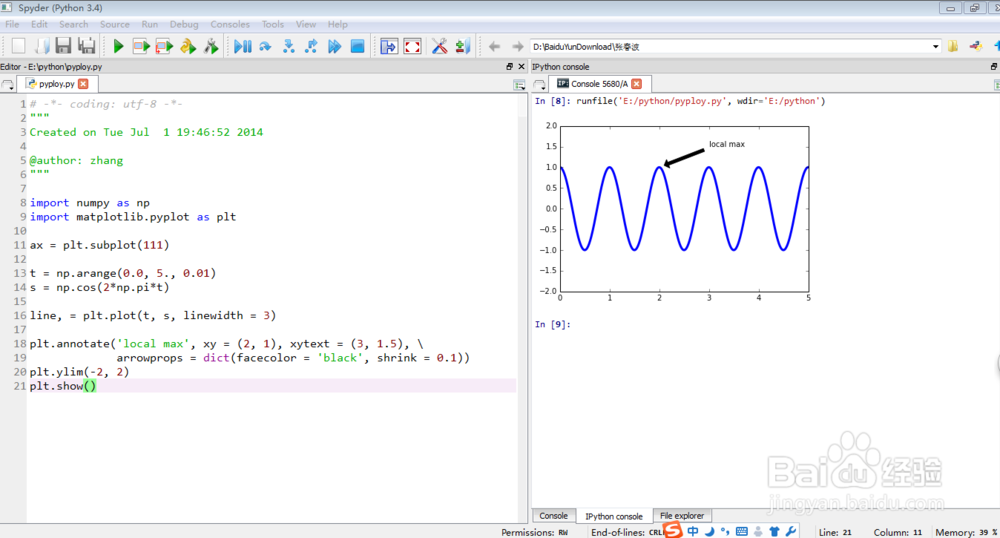
2、输入以下代码,或直接复制粘贴,注意格式
import numpy as np
import matplotlib.pyplot as plt
ax = plt.subplot(111)
t = np.arange(0.0, 5., 0.01)
s = np.cos(2*np.pi*t)
line, = plt.plot(t, s, linewidth = 3)
plt.annotate('local max', xy = (2, 1), xytext = (3, 1.5), \
arrowprops = dict(facecolor = 'black', shrink = 0.1))
plt.ylim(-2, 2)
plt.show()