1、根据图示点击“New Panel”下的 Singlestat组件

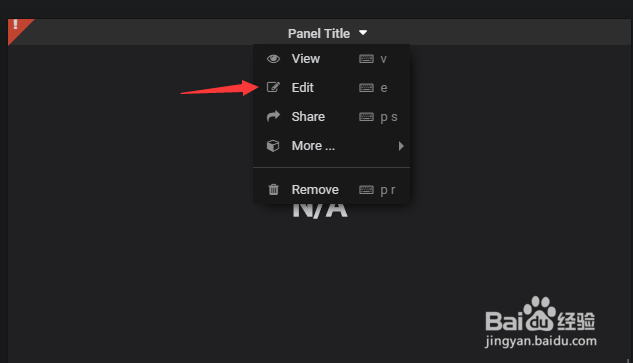
2、根据图示,依次点击“Panel Title”,点击“Edit”,编辑图形属性
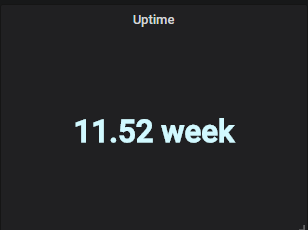
3、选择General,在Title选择输入:Uptime

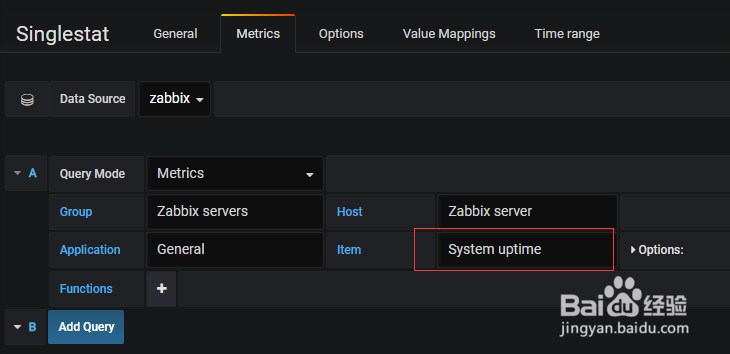
4、选择Metrics
数据源选择zabbix,Application应用集选择General,Item监控项选择“System uptime”
5、选择Options
Stat 选择 “First”,Unit选择“seconds(s)”此单位为秒,勾选Coloring的Value值,可在下方的colors选择其他颜色展示

6、保存图形,缩小图像框,最终效果见图示