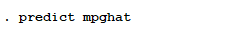
1、打开数据文件。用命令generate wtsq=weight^2,定义wtsq。用命令predict mpghat定义变量mpghat用于存储MPG预测值。
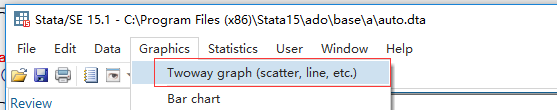
2、接下来我们绘制图形。点击 Graphics| twoway Graph
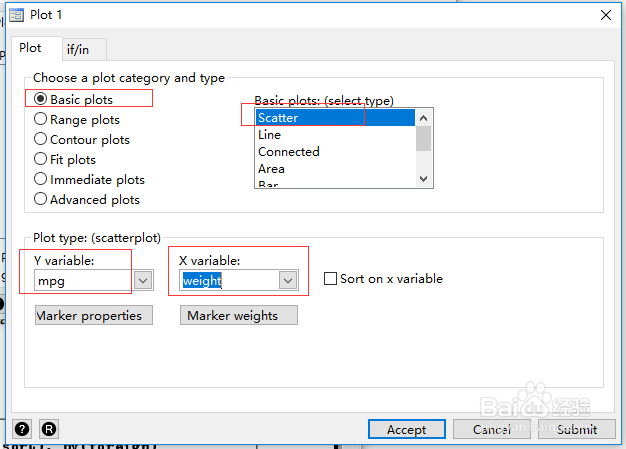
3、配置mpg与weight之间的曲线图形。
(1)点击 Create,选择 Basic plots 和Scatter
(2)配置Y变量为mpg,配置x为weight
(3)点击accept
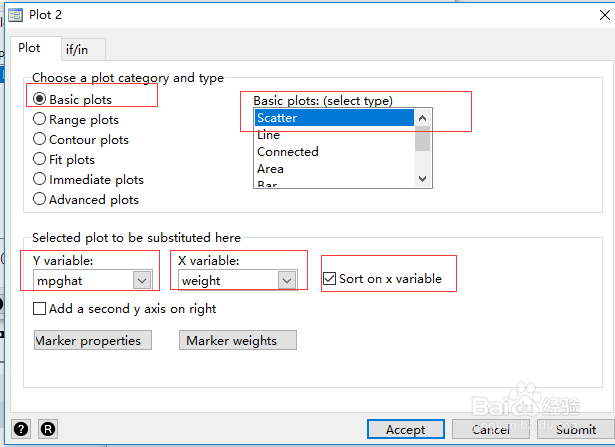
4、 配置mpghat与weight之间的曲线图形。
(1)点击 Create,选择 Basic plots 和Scatter
(2)配置Y变量为mpghat,配置x为weight
(3)点击accept
(4) 选中 sort on x variable
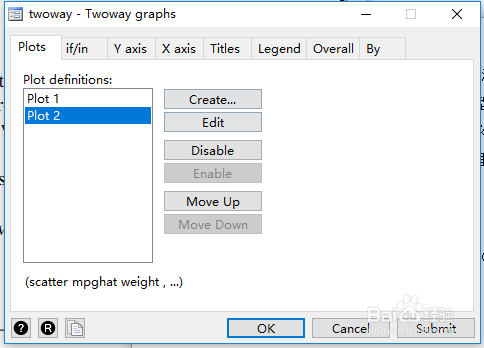
5、配置完成后,在plot definitions中会出现两个plot
6、进入by 页面,勾选 subgraphs for unique values of variables,选择变量foreign
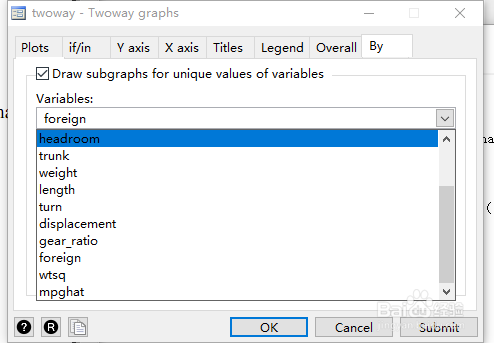
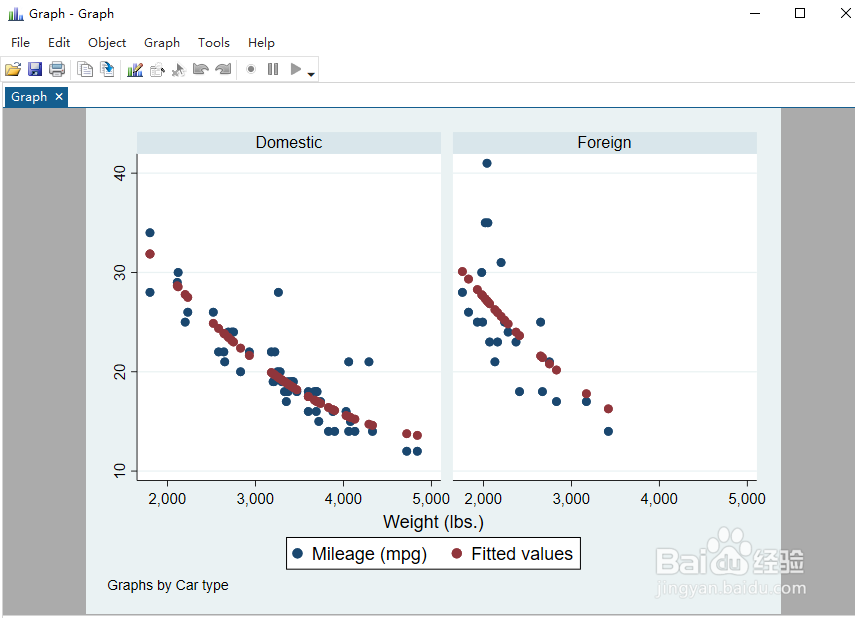
7、点击ok ,输出结果如下图